

Building a RISC-V Processor with Chipyard: Debugging the Halt Failure
Chipyard is an open-source framework for designing, simulating, and testing RISC-V processors and systems-on-chip (SoCs). It comes with a few flavors of RISC-V cores, including Rocket, BOOM, and others. It also comes with a lot of pre-built components and tools to help you get started quickly. Because Chipyard supports building production-grade core configurations that can work with industry standard EDA tools, as well as hobbyist-grade verilator models and FPGA targets, it is a great choice for both learning and professional development. However, this also makes the learning curve a bit steep for beginners.
When I initially started working with Chipyard, I made the naive assumption that I could simply clone the repository, run a few commands, and have a working RISC-V processor in no time. Little did I know that I will have to go implement a fix deep within the RocketCore CSRs to get this running. That was a fun learning experience though, and I am documenting the entire journey here for anyone else who might be interested in replicating this setup.
TL;DR Incident report
Problem: OpenOCD could not halt the Rocket Core, showing “Hart failed to halt” error, completely blocking all JTAG debugging.
Root Cause: A timing race condition where the TLB checked debug status one cycle before it was updated, causing it to deny access to the Chipyard debug ROM at address 0x800.
Fix: Changed io.status.debug from being driven by a registered signal (reg_debug) to a combinational signal (trapToDebug), making debug status visible in the same cycle as the debug exception.
Impact: Enables JTAG debugging to work correctly. The fix is minimal (one line), has no performance cost, and aligns with the architectural intent that debug mode should be visible immediately when a debug exception is taken.
I will go into more details of how I fixed this issue later in the post.
Objectives and Background
The objective we are setting out to achieve is to:
- Build a simple RISC-V processor using Chipyard.
- Simulate it using verilator.
- Write, and build a custom test program to run on our core.
- Run the test program on the simulated core.
- Attach a debugger to the running core.
- Step through the program using the debugger.
Yeah, as I stated earlier, I was naive. But hey, where is the fun in taking the easy route ?
I thought I knew how RISC-V debug works. But I had to learn a lot more about how RISC-V debug works in order to get everything working with Chipyard.
When I first brought up a rocket core back in 2020 on an FPGA to boot linux, Chipyard was in its infancy and I used the rocket core repo directly. You can find my old blog post about that here. Since then, Chipyard has matured a lot and now provides a much better framework for building RISC-V processors and systems.
Chipyard is built on top of several other open-source projects. The documentation says:
Chipyard is a framework for designing and evaluating full-system hardware using agile teams. It is composed of a collection of tools and libraries designed to provide an integration between open-source and commercial tools for the development of systems-on-chip
It is essentially a one-stop-shop for RISC-V SoC design. It integrates with several other projects including Rocket Chip, BOOM, FireSim, and more.
Environment setup
To install dependencies with the following steps:
# Update System
sudo apt-get update
sudo apt-get upgrade -y

# Install Build Tools
sudo apt-get install -y build-essential bison flex software-properties-common curl git \
    libgmp-dev libmpfr-dev libmpc-dev zlib1g-dev vim device-tree-compiler \
    libboost-regex-dev libboost-system-dev \
    libtool libtool-bin autoconf automake pkg-config texinfo gperf libusb-1.0-0-dev
Chipyard uses Conda to manage its dependencies.
# Download Miniforge (conda alternative)
curl -L -O "https://github.com/conda-forge/miniforge/releases/latest/download/Miniforge3-$(uname)-$(uname -m).sh"

# Install
bash Miniforge3-$(uname)-$(uname -m).sh -b

# Initialize conda
source ~/miniforge3/bin/activate
conda init

# IMPORTANT: Restart your terminal after this step
After restarting terminal:
# Install conda-lock (CRITICAL for Chipyard build-setup)
conda install -n base -c conda-forge conda-lock
Next, clone the Chipyard repository and initialize the submodules:
git clone [https://github.com/ucb-bar/chipyard.git](https://github.com/ucb-bar/chipyard.git)
cd chipyard
git checkout 1.13.0


# Initialize Submodules and build setup
./build-setup.sh riscv-tools

#build openocd
./scripts/build-openocd.sh

# Source the environment variables
source env.sh
This script will take a while to complete as it downloads dependencies and submodules and builds a few.
Understanding Chipyard structure and configurations
Before we proceed to build our RISC-V processor, it’s important to understand the structure of the Chipyard repository. Understanding the directory layout helped me navigate a few issues I ran into later on.
I am not doing an extensive walkthrough of the entire repo, but here are some of the directories I looked into to get a sense of how things are organized:
generators/: Contains the scala code for generating RISC-V cores and SoCs.rocket-chip/: The heavily parametrized rocket core generator code written in scala that is passed on to chisel to generate verilog./src/main/scala/rocket/: Contains the rocket core specific code.CSR.scalais a good example to start.
rocket-chip-blocks/: Contains peripheral blocks for the rocket core.src/main/scala/devices/uart/: Contains the UART peripheral scala code.
chipyard/src/main/scala/config: Contains the configuration files for different SoC builds.RocketConfigs.scala: Contains various rocket core configurations. More on this later below.
toolchains/: Contains the RISC-V toolchain installation setup during build-setup.sims/verilator/: Contains verilator simulation environment setup and testbenches.
The RocketConfigs.scala file contains various configurations for the rocket core. Each configuration is a class that extends from a base configuration class and overrides certain parameters to customize the core. This is used by the build system to generate different core variants.
For instance the RocketConfig class is defined as follows:
RocketConfig
├── Rocket Tile (1x Large Core)
│   ├── 64-bit RISC-V ISA (RV64IMAFDC)
│   ├── L1 Instruction Cache (I$)
│   ├── L1 Data Cache (D$)
│   ├── Hardware FPU
│   ├── Hardware Multiply/Divide
│   └── MMU with Virtual Memory
│
├── Memory Hierarchy
│   ├── L2 Cache (SiFive Inclusive Cache)
│   ├── 64 KiB On-chip Scratchpad (@ 0x08000000)
│   ├── 1x AXI4 Memory Channel
│   └── Serial TileLink Interface
│
├── Bus Interconnect (Coherent, Hierarchical)
│   ├── SBUS - System Bus (500 MHz)
│   ├── MBUS - Memory Bus (500 MHz)
│   ├── PBUS - Peripheral Bus (500 MHz)
│   ├── FBUS - Front Bus (500 MHz)
│   └── CBUS - Control Bus (500 MHz)
│
├── Peripherals & I/O
│   ├── UART
│   ├── Boot ROM
│   ├── GPIO
│   ├── SPI Flash Interface
│   └── Boot Address Register
│
└── Debug Infrastructure
    ├── JTAG Debug Module
    ├── System Bus Access (SBA)
    └── Debug Memory (8 data words)
Since we will be using verilator to simulate our core, our starting point is the Makefile in the sims/verilator directory. Verilator is a great tool for simulating hardware designs as it converts Verilog code into C++ code, which can then be compiled and executed. This allows for fast simulation speeds and allows easy software control over the simulation. The preferred configuration for verilator simulations in Chipyard is the FastRTLSimRocketConfig, which is optimized for fast simulation speeds by removing the TileLink protocol checkers/monitors to reduce simulation overhead and improve simulation speed.
Note: I faced some additional issues when using the
RocketConfigconfiguration with the TileLink monitors asserting when when OpenOCD performs byte-level memory writes. Using theFastRTLSimRocketConfigconfiguration resolved these issues without needing any additional code changes.
The next step is to build the verilator simulation using the desired configuration.
Chipyard design hierarchy and boot flow
Sim hirearchy and testbench structure
To build the verilator simulation, we issue a make command from within the sims/verilator directory. We can pass the CONFIG variable to the make to point the build to FastRTLSimRocketConfig configuration for our simulation.
Since Verilator simulates the hardware design, the makefile is setup to wrap the design in a testbench that provides the necessary stimulus and environment for the design to operate correctly. Understanding the design hierarchy is important to understand how the testbench interacts with the core.
The makefile first invokes the Chisel build system to generate the Verilog code for the specified configuration. The generated Verilog code is then compiled by Verilator along with the testbench code to create the final simulation binary.
The Chisel build command used in the makefile looks like this:
java -cp <classpath> chipyard.Generator \
  --target-dir <build_dir> \
  --name chipyard.harness.FastRTLSimRocketConfig \
  --top-module chipyard.harness.TestHarness \
  --legacy-configs chipyard:FastRTLSimRocketConfig
The overall module hirearchy of the generated design looks like this:
Verilog Testbench] --> B[TestHarness
Chisel Module] B --> C[ChipTop
LazyModule] B --> H[Harness Binders
Simulation Models] C --> D[system
DigitalTop] D --> E[tile_prci_domain] E --> F[RocketTile] F --> G1[Rocket Core
CPU Pipeline] F --> G2[Frontend
Instruction Fetch] F --> G3[DCache] H --> H1[SimDRAM
Memory Model] H --> H2[SimTSI
Program Loader] H --> H3[SimJTAG
Debug Interface] H --> H4[UARTAdapter
Console I/O] H --> H5[Clock Generators] style C fill:#e1f5ff style F fill:#fff4e1 style H fill:#f0f0f0
These are some pointers to the Code organisation resulting in this hireacrchy:
generators/chipyard/src/main/scala/harness/TestHarness.scala: Defines theTestHarnessmodule that instantiatesChipTopand connects the simulation models.generators/chipyard/src/main/scala/ChipTop.scala: Defines theChipTopmodule that instantiates theDigitalTopsystem.
Boot and execution flow in the Chipyard Verilator sim
When we run a Verilator simulation, the core starts in reset, executes a bootrom, waits for code to be loaded via TSI (Test Serial Interface), and then jumps to execute that code.
generators/rocket-chip/src/main/resources/vsrc/TestDriver.v is the top-level Verilog testbench that instantiates the TestHarness module and provides clock/reset generation, memory model, TSI interface, JTAG interface, and UART console. This is how the hardware hireatcgy looks like:
TestDriver (Verilog wrapper)
└─ TestHarness (Chisel Module)
    ├─ ChipTop (LazyModule - the DUT)
    │   ├─ system (DigitalTop)
    │   │   ├─ bootrom (at address 0x10000)
    │   │   │   └─ Contains boot code in bootrom.img
    │   │   ├─ bootaddr_reg (at address 0x1000)
    │   │   │   └─ Holds boot address (default: 0x80000000)
    │   │   ├─ tile_prci_domain
    │   │   │   └─ tile (RocketTile with Rocket core)
    │   │   │       └─ Starts at reset vector (0x10000)
    │   │   └─ fbus (Front bus for serial TileLink)
    │   └─ Ports (serial_tl, uart, debug, etc.)
    │
    └─ Harness Components (simulation models)
        ├─ SerialRAM (harness-side memory)
        │   ├─ TSIToTileLink converter
        │   └─ TL RAM/ROM models
        └─ SimTSI (C++ DPI module)
            └─ Connects to SerialTL port
The Boot Address Register is set in generators/testchipip/src/main/scala/boot/BootAddrReg.scala and is memory-mapped at address 0x1000. It holds the address where the core will jump to after the bootrom execution. By default, it is set to 0x80000000, which is the start of DRAM.
generators/testchipip/src/main/resources/testchipip/bootrom/bootrom.S contains the assembly code for the bootrom. Core immediately goes into a wait-for-interrupt (WFI) loop. It’s waiting for an MSIP (Machine Software Interrupt) to wake it up.
_hang:  // Reset vector entry point
  la a0, _start          // Load address of _start
  csrw mtvec, a0         // Set trap vector to _start
  li a0, 8               // MSIP bit (Machine Software Interrupt Pending)
  csrw mie, a0           // Enable MSIP in mie CSR
  csrs mstatus, a0       // Enable interrupts in mstatus

wfi_loop:                // WAIT FOR INTERRUPT
  wfi                    // Core goes to sleep here
  j wfi_loop
When we execute the sim, we will be passing an elf file to parse and load into the memory through a commandline argument. The code in chipyard/generators/testchipip/src/main/resources/testchipip/csrc/testchip_tsi.cc implements the TSI protocol to load the elf file into the simulated memory.
The boot sequence looks like this:
0x10000 participant BootReg as BootAddr Reg
0x1000 participant CLINT as CLINT
0x2000000 participant DRAM as DRAM
0x80000000 Note over Core: Reset Core->>BootROM: Jump to 0x10000 BootROM->>BootROM: Setup trap handler BootROM->>BootROM: Enable MSIP interrupt BootROM->>BootROM: Enter WFI loop Note over TSI: Load program via TSI TSI->>DRAM: Write ELF to 0x80000000 TSI->>BootReg: Write boot address TSI->>CLINT: Trigger MSIP (wake core) CLINT-->>Core: MSIP interrupt Core->>BootROM: Handle interrupt (_start) BootROM->>CLINT: Clear MSIP BootROM->>BootReg: Read boot address BootROM->>Core: Set mepc = 0x80000000 BootROM->>Core: mret (jump to program) Core->>DRAM: Execute program at 0x80000000
The key steps are:
- Loads your program into DRAM (at
0x80000000) via TSI write commands - Writes boot address to bootaddr_reg (
0x1000) via +init_write or automatically - Triggers MSIP for hart 0 (writes to CLINT at
0x2000000) to wake up the core that is waiting in WFI loop in the bootrom.
_start:  // Interrupt handler (set as mtvec)
  li a1, 0x2000000       // CLINT base address
  csrr a0, mhartid       // Get hart ID
  bnez a0, boot_core     // Multi-hart handling

boot_core_hart0:
  sw zero, 0(a1)         // Clear the MSIP interrupt
  li a0, BOOTADDR_REG    // Load 0x1000
  ld a0, 0(a0)           // Read boot address from bootaddr_reg
  csrw mepc, a0          // Set return address to boot addr (0x80000000)
  csrr a0, mhartid       // hartid for bootloader (a0 arg)
  la a1, _dtb            // DTB address for bootloader (a1 arg)
  li a2, 0x80
  csrc mstatus, a2       // Clear MPIE
  mret                   // Return from interrupt -> jumps to 0x80000000!
The code executing from the 0x80000000 address is your custom test program that you compiled and passed to the simulator. The core will now execute your program. To indicate program completion, you can use the mtohost csr to write a value back to the simulation environment.
// In your test program:
write_csr(mtohost, 1);  // Exit code 1 = success
// SimTSI detects this and returns exit code to the simulator
We can alternatively use the DMI/JTAG interface for program load, debugging etc. That is what we will use for our debugging setup with OpenOCD and GDB. WithSimJTAGDebug extends HarnessBinder in generators/chipyard/src/main/scala/harness/HarnessBinders.scala enables this mode.
The
1.13.0release of Chipyard (Current Latest) has a bug in the RocketCore CSR code that prevents OpenOCD from halting the core correctly. We will need to apply a small fix to the RocketCore CSR code before building the simulation. Let’s dive into that debug story next. It also gives an idea of how to debug such issues in the future.
Fixing the debugger halt issue with a patch
Tl;DR / dont bore me with details
Apply this fix before building the verilator simulation. If you don’t want to go through the detals, skip the rest of this section.
To apply the fix automatically:
cd /generators/rocket-chip

# Backup original file
cp src/main/scala/rocket/CSR.scala src/main/scala/rocket/CSR.scala.orig

# Apply the fix
sed -i '1004s/io.status.debug := reg_debug/io.status.debug := trapToDebug/' \
    src/main/scala/rocket/CSR.scala

# Add comment above (optional, for documentation)
sed -i '1005i\  // FIX: Set debug status combinationally when taking debug exception\n  // This allows TLB to recognize debug mode BEFORE instruction fetch to debug ROM\n  // Without this, TLB denies access to debug ROM (0x800) causing halt failure' \
    src/main/scala/rocket/CSR.scala
Verify the change:
grep -A 3 "io.status.debug :=" src/main/scala/rocket/CSR.scala
Expected output:
  io.status.debug := trapToDebug
  io.status.isa := reg_misa
The debug Journey
It might be better to skip this section if you are not interested in the nitty-gritty details of the debugging process. This section also jumps ahead and uses some commands that are explained later in the post. Maybe you can come back to this section after reading the rest of the post.
While I Was trying to set up GDB and OpenOCD to debug my RISC-V core, I ran into an issue that took me a while to figure out. It started manifesting as TileLink monitor assertion failures during memory write operations initiated by OpenOCD and when unblocked by moving to FastRTLSimRocketConfig started showing the cores not halting when requested by openocd/gdb.
This is how it manifested:
Open On-Chip Debugger 0.12.0+dev-03904-gc8b0535b6 (2025-12-19-23:42)
Licensed under GNU GPL v2
Info : JTAG tap: riscv.cpu tap/device found: 0x00000001 (mfg: 0x000 (<invalid>), part: 0x0000, ver: 0x0)
Info : [riscv.cpu] datacount=8 progbufsize=16
Error: [riscv.cpu] Unable to halt. dmcontrol=0x80000001, dmstatus=0x00030ca2
Error: [riscv.cpu] Fatal: Hart 0 failed to halt during examine
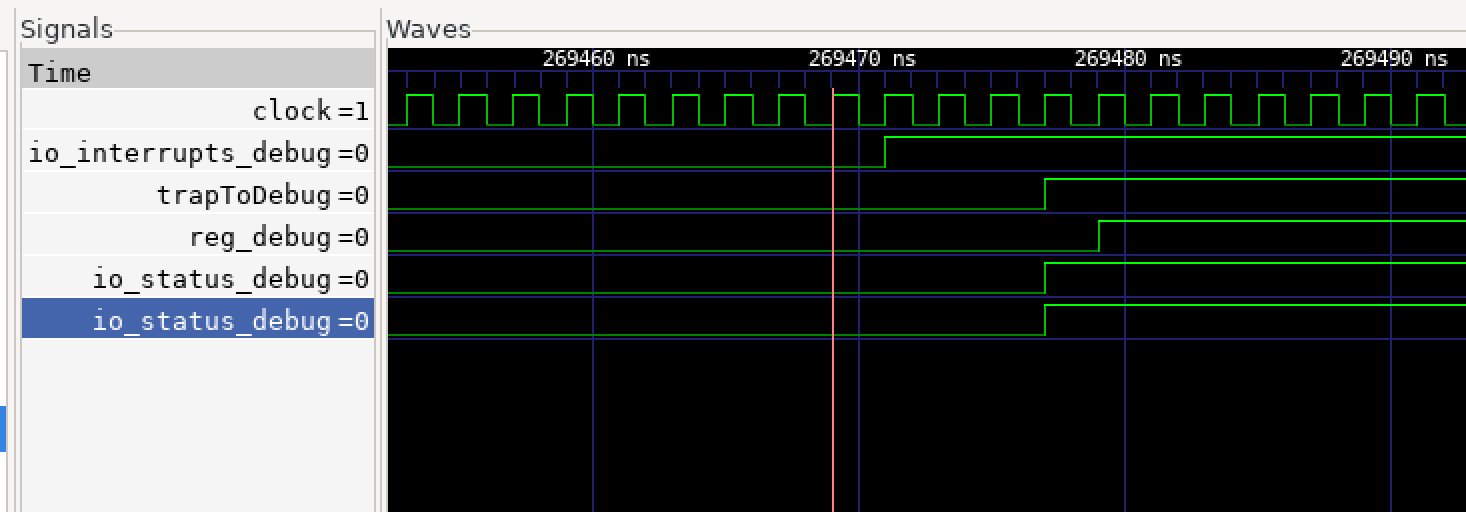
From my previous experience with RocketCore, I had some idea of where to look for this. Like with all other hardware simulation debug, dumping the waveforms during simulation to look at the io_status_debug and related signals in the CSR module helped me understand what was going on.
Capturing VCD Waveforms
To capture waveforms, I rebuilt the simulator with debug symbols and VCD support:
cd sims/verilator
make CONFIG=FastRTLSimRocketConfig debug
Then ran it with VCD dumping enabled:
./simulator-chipyard.harness-FastRTLSimRocketConfig-debug \
    main.elf \
    +jtag_rbb_enable=1 \
    +vcdfile=debug_halt.vcd \
    +max-cycles=300000
The +max-cycles flag is important because WFI would cause an infinite loop otherwise.
Analyzing the Waveforms
Opening the VCD in GTKWave, I focused on these signals:
trapToDebug- When debug exception is takenreg_debug- The registered debug statusio_status_debug- What the TLB seesio_ptw_status_debug- TLB’s specific viewcore_PC- Program counter
When PC jumped to 0x800, trapToDebug went HIGH immediately, but io_status_debug was still LOW because it was driven by reg_debug which updates one cycle later.
The TLB checks debug status in the same cycle as the PC change. Seeing io_status_debug = 0, it denied access to the debug ROM region at 0x800, causing an instruction access fault.
Here’s the timing issue visualized:
0x800 Note over OpenOCD,DebugROM: BUGGY BEHAVIOR (Before Fix) OpenOCD->>Core: Send halt request Core->>CSR: trapToDebug = 1 Note over CSR: reg_debug still 0
(updates next cycle) CSR->>TLB: io_status_debug = 0 Core->>TLB: Fetch from 0x800 TLB->>TLB: Check debug status = 0 TLB-->>Core: Access Denied! Note over Core: Instruction Fault
Halt FAILS Note over OpenOCD,DebugROM: FIXED BEHAVIOR (After Fix) OpenOCD->>Core: Send halt request Core->>CSR: trapToDebug = 1 CSR->>TLB: io_status_debug = trapToDebug = 1 Core->>TLB: Fetch from 0x800 TLB->>TLB: Check debug status = 1 TLB->>DebugROM: Access Granted DebugROM-->>Core: Debug code Note over Core: Halt SUCCESS ✓
Building the verilator simulation
Once the patch is applied, we can proceed to build the verilator simulation using the FastRTLSimRocketConfig configuration using the following commands:
cd sims/verilator
make CONFIG=FastRTLSimRocketConfig -j$(nproc)
This generates the verilator simulation binary named simulator-chipyard.harness-FastRTLSimRocketConfig in thesims/verilator/ directory.
The Fix
Looking at generators/rocket-chip/src/main/scala/rocket/CSR.scala around line 1004:
// Original buggy code:
io.status.debug := reg_debug  // ← Uses registered signal!

// The fix:
io.status.debug := trapToDebug  // ← Use combinational signal!
The signal trapToDebug is already computed and goes HIGH immediately when the debug exception is taken. By routing it directly to io.status.debug, the TLB sees the correct debug status in the same cycle.
After the fix `io.status.debug` goes HIGH in the same cycle as `trapToDebug`, allowing TLB to grant access to debug ROM.
WFI Limitation
After applying the CSR fix and rebuilding, I started running ingo another issue where the OpenOCD still could not halt the core. But the verbose logging was showing slightly different behavior now.
The error was the same:
Error: [riscv.cpu] Unable to halt
In the simulation, when verbose logging is enabled, I saw the core was stuck at a specific PC:
C0: 54 [1] pc=[0000000000010034] inst=[10500073] DASM(10500073)
That instruction is WFI in the bootrom.
BootROM waiting for MSIP interrupt in WFI loop
Taking a closer look at the bootrom code, I realized the core was stuck in the WFI loop waiting for an MSIP interrupt to wake it up. This works well when using TSI to load programs, as TSI triggers the MSIP after loading the program. But with JTAG debug, there is no automatic MSIP trigger.
When we run with a normal program with
./simulator-chipyard.harness-FastRTLSimRocketConfig main.elf +jtag_rbb_enable=1
The sequence is:
- Core boots, enters bootrom at 0x10000
- Bootrom sets up trap handler
- Bootrom enters WFI loop waiting for MSIP from HTIF/TSI
- HTIF/TSI would normally: - Load your program to 0x80000000 - Write boot address register - Send MSIP interrupt to wake core
- Core wakes from WFI, takes MSIP interrupt, handler jumps to 0x80000000
But with JTAG debug:
- Core boots, enters bootrom
- Bootrom enters WFI waiting for MSIP
- User tries to attach debugger
- Debug interrupt arrives
- PROBLEM: HTIF never sent MSIP because you’re trying to use JTAG instead!
- Bootrom is waiting for MSIP specifically
- Even though debug interrupt might wake from WFI temporarily, the bootrom code just… stays in its WFI loop forever
The solution is to pass BINARY=none when runnning the simulation and manually load the program via GDB after attaching. This way, the test harness TSI immediately triggers the MSIP after reset, allowing the core to exit WFI and be ready for debugging.
Building the Verilator Simulation
Important: Before building, make sure you’ve applied the CSR fix described in the previous section. The fix must be in place before you build, as it’s compiled into the simulator binary.
Once the patch is applied, we can proceed to build the verilator simulation using the FastRTLSimRocketConfig configuration using the following commands:
cd sims/verilator
make CONFIG=FastRTLSimRocketConfig -j$(nproc)
Building Source Code Test Programs
To build test programs to run on our RISC-V core, we can use the RISC-V toolchain that was installed during the Chipyard setup. The toolchain includes riscv64-unknown-elf-gcc for compiling C code into RISC-V binaries.
mkdir -p ~/riscv-test
cd ~/riscv-test
# Create a simple test program
This is out test ptogram main.c:
#include <stdint.h>

// --- Magic Symbols for Chipyard/HTIF ---
// The harness looks for these to know the CPU is alive and to handle exit codes.
volatile uint64_t tohost __attribute__((section(".htif")));
volatile uint64_t fromhost __attribute__((section(".htif")));
// ---------------------------------------

volatile int counter = 0;

int main() {
    int a = 5;
    int b = 10;

    while(1) {
        counter++;
        a = a + b;
        if (counter > 100) {
            counter = 0;
        }
    }
    return 0;
}
To build it, we can use the following command:
cd ~/chipyard/chipyard
source env.sh  # Always source first!

cd ~/riscv-test

# Compile main program (with debug symbols)
riscv64-unknown-elf-gcc -O0 -g -static -specs=nano.specs \
    -Wl,-Ttext=0x80000000 -o main.elf main.c
We intentionally skipped using uart or printing a message to keep things simple. The program just increments a counter in an infinite loop taht we can observe in the debugger in the next steps.
Running the simulation with OpenOCD and GDB
To enable debugging with OpenOCD and GDB, we need to configure OpenOCD to connect to the verilator simulation’s JTAG interface. We will create a configuration file named jtag_sim.cfg with the following content adjested for our source code location:
# Adapter configuration
adapter speed 10000
adapter driver remote_bitbang
remote_bitbang host localhost
# !!! UPDATE THIS PORT FROM SIMULATOR OUTPUT !!!
remote_bitbang port 12345

# RISC-V target configuration
set _CHIPNAME riscv
jtag newtap $_CHIPNAME cpu -irlen 5

set _TARGETNAME $_CHIPNAME.cpu
target create $_TARGETNAME riscv -chain-position $_TARGETNAME

# With BINARY=none, CPU can halt properly during init
# No need to defer examination
# $_TARGETNAME configure -defer-examine

# --- Debug Configuration ---
# Force hardware breakpoints (no memory writes needed)
gdb breakpoint_override hard

# Use sysbus for memory access (faster, supports all memory regions)
# System bus access is enabled via WithDebugSBA in Chipyard config
riscv set_mem_access sysbus

# Disable virtual memory lookup (prevents random page table walks)
riscv set_enable_virt2phys off

# 5 second timeout for simulator latency
riscv set_command_timeout_sec 5

# Note: set_prefer_sba is not available in OpenOCD 0.12.0
# System bus will be used automatically via set_mem_access sysbus

init

# With BINARY=none, halt should work during init
halt
Note: The
riscv set_mem_access sysbussetting is critical. Without it, GDB’sloadcommand will fail with “Failed to write memory” errors. Chipyard’sAbstractConfigincludesWithDebugSBAwhich enables system bus access in hardware.
We will also create a gdb_init.gdb file to automate GDB commands:
# GDB initialization script for Chipyard debugging
# Usage: riscv64-unknown-elf-gdb ~/riscv-test/main.elf -x ~/riscv-test/gdb_init.gdb
echo \n=== Chipyard RISC-V GDB Setup ===\n\n
# Increase timeout for slow simulator
set remotetimeout 300
# Connect using extended-remote (recommended by OpenOCD)
target extended-remote localhost:3333
echo Resetting and halting CPU...\n
monitor reset halt
echo Loading program...\n
load
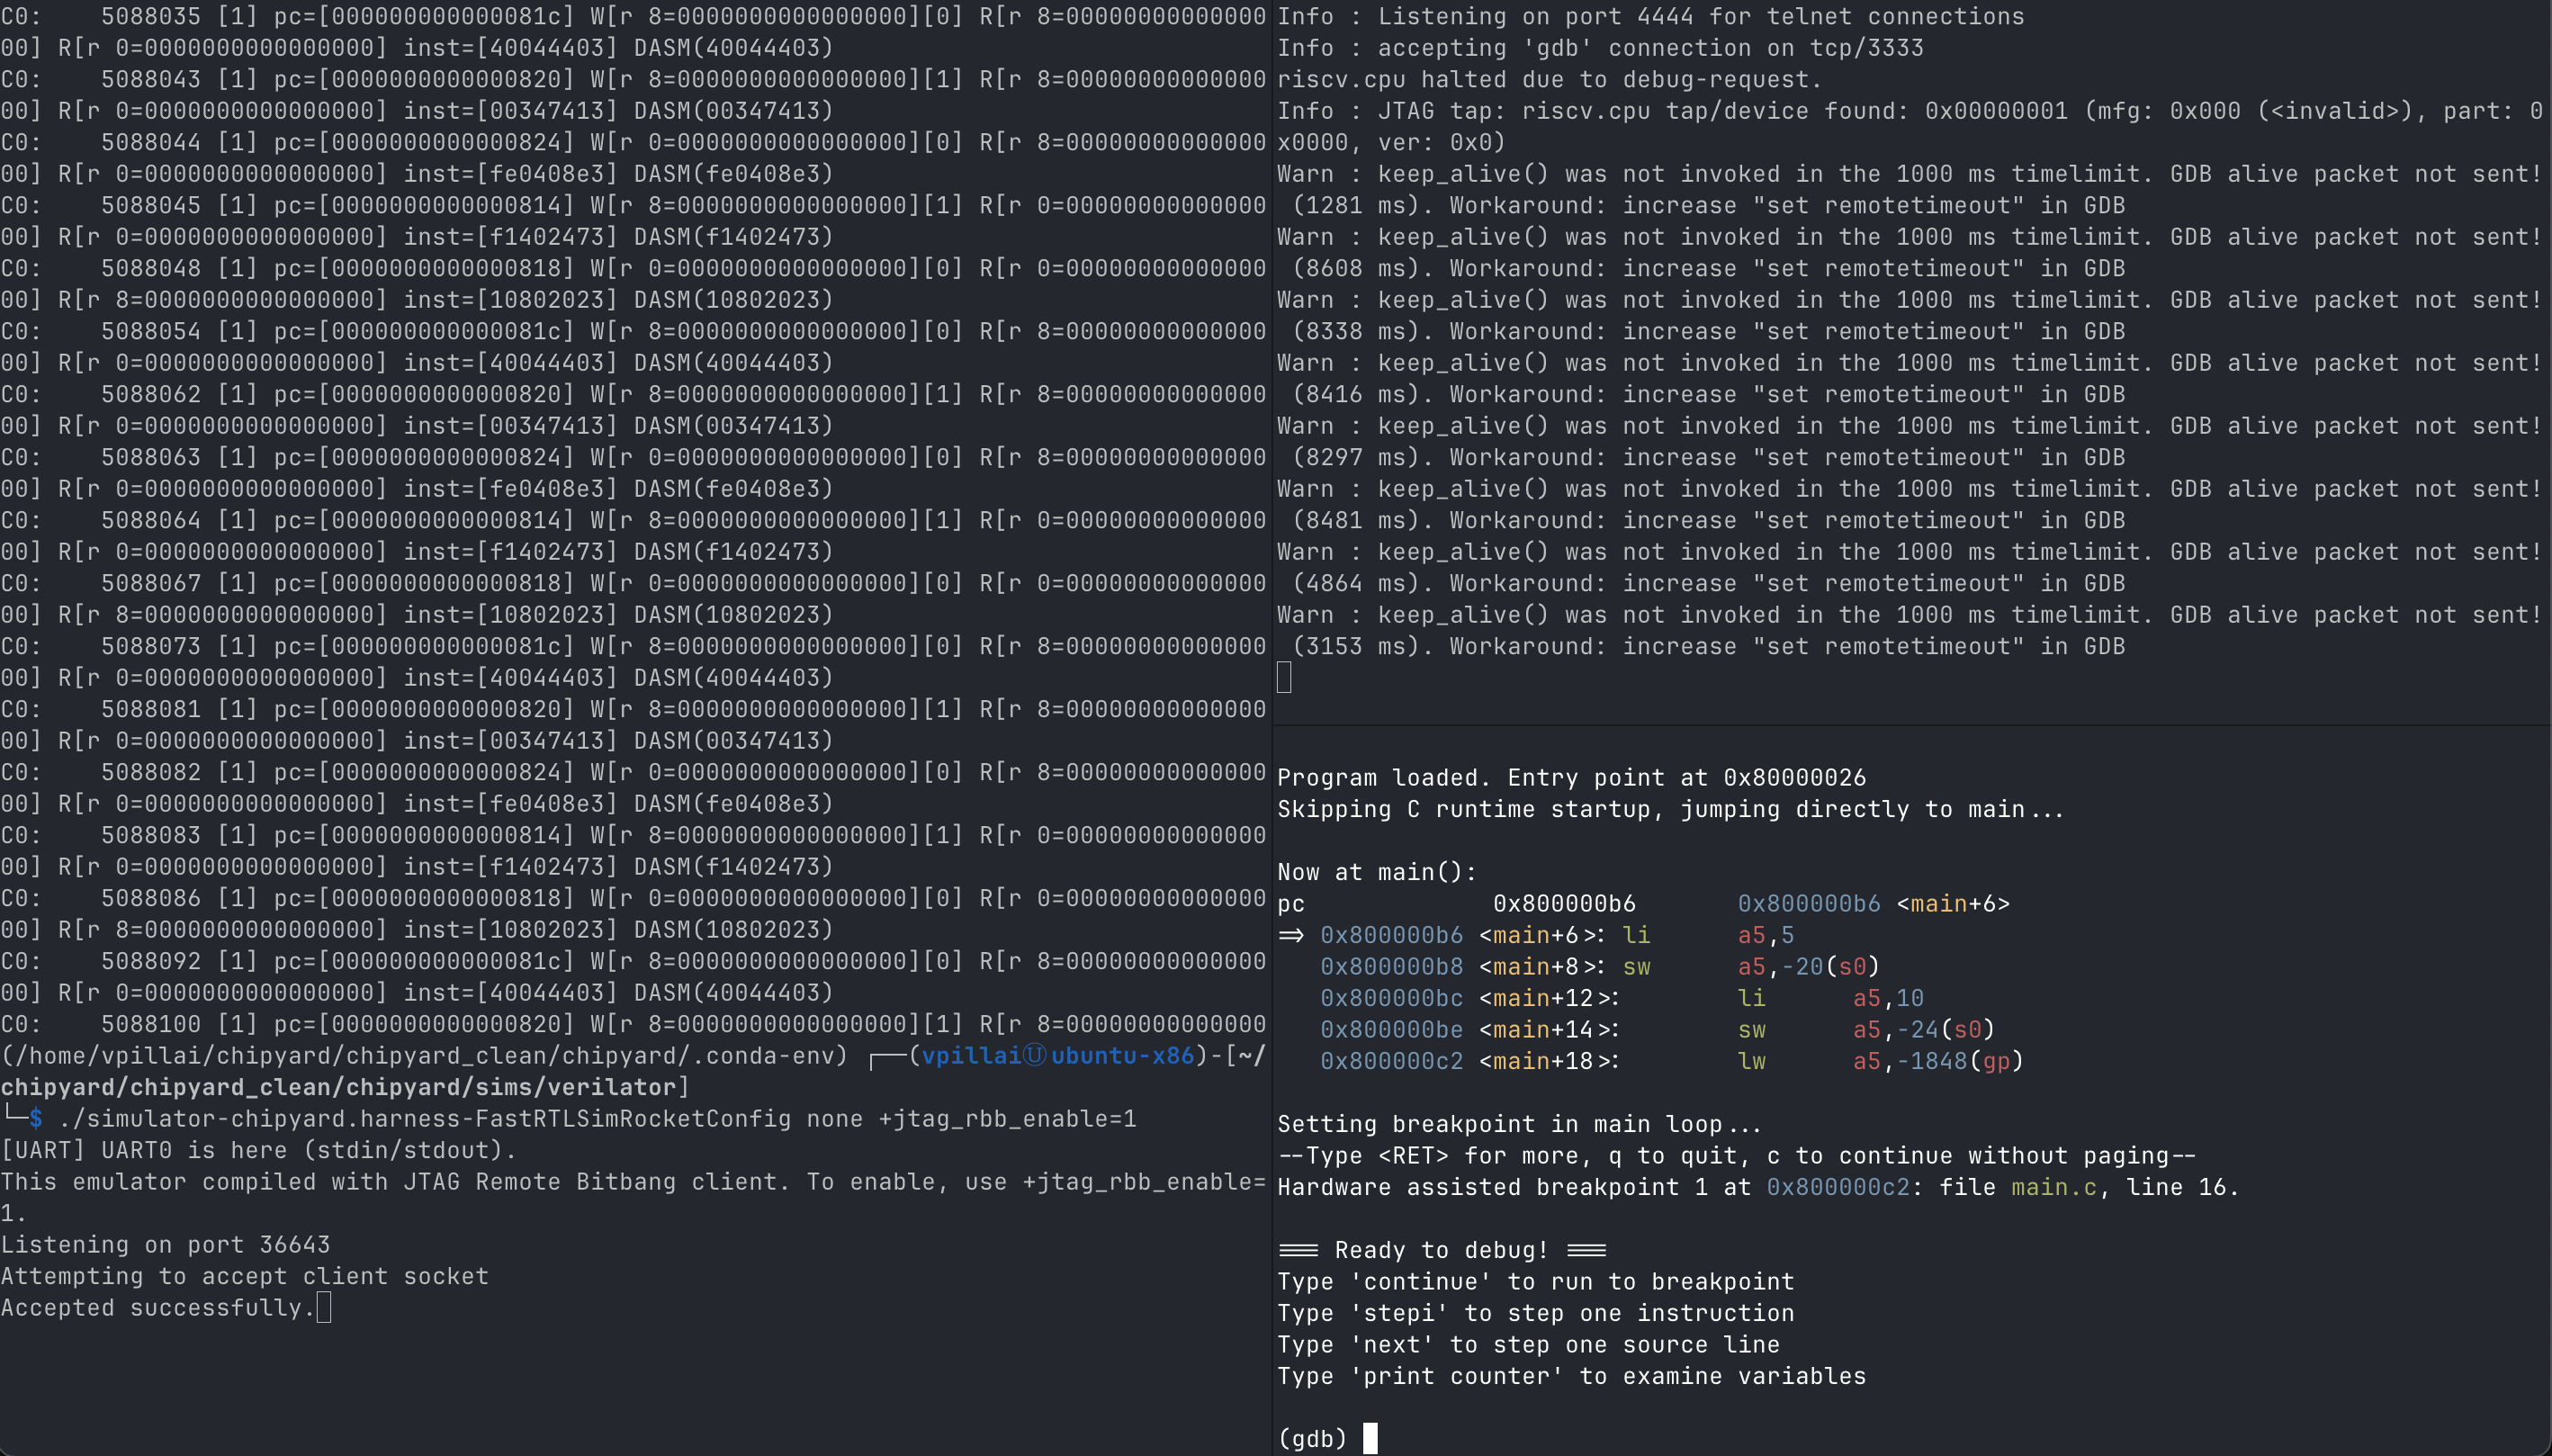
echo \nProgram loaded. Entry point at 0x80000026\n
# Skip C runtime startup and jump directly to main
echo Skipping C runtime startup, jumping directly to main...\n
# Set PC to main
set $pc = 0x800000b6
# Set up stack
set $sp = 0x80010000
set $fp = 0x80010000
# Set arguments to 0
set $a0 = 0
set $a1 = 0
echo \nNow at main():\n
info registers pc
x/5i $pc
echo \nSetting breakpoint in main loop...\n
hbreak *0x800000c2
echo \n=== Ready to debug! ===\n
echo Type 'continue' to run to breakpoint\n
echo Type 'stepi' to step one instruction\n
echo Type 'next' to step one source line\n
echo Type 'print counter' to examine variables\n\n
We can now run and attach the debugger. This requires a three terminal setup:
Three terminal setup: 1) Verilator sim, 2) OpenOCD, 3) GDB
-
Terminal 1: Run the Verilator simulation
 cd chipyard
 source env.sh

 cd sims/verilator
 ./simulator-chipyard.harness-FastRTLSimRocketConfig \
   none \
   +verbose \
   +jtag_rbb_enable=1
Expected output:
[UART] UART0 is here (stdin/stdout). This emulator compiled with JTAG Remote Bitbang client. To enable, use +jtag_rbb_enable=1. Listening on port 37823 Attempting to accept client socket -
Terminal 2: Run OpenOCD to connect to the simulation
 cd chipyard
 source env.sh

 cd ~/riscv-test

 # IMPORTANT: Update the port in jtag_sim.cfg first
 # Edit the file and change remote_bitbang_port to match the simulator's port

 vi jtag_sim.cfg  # or use your preferred editor

 # Start OpenOCD

 openocd -f jtag_sim.cfg
Expected output:
Open On-Chip Debugger 0.12.0+dev-04007-g3bed4c801 (2025-12-20-15:48) Licensed under GNU GPL v2 For bug reports, read <http://openocd.org/doc/doxygen/bugs.html> Info : auto-selecting first available session transport "jtag". To override use 'transport select <transport>'. force hard breakpoints Info : Initializing remote_bitbang driver Info : Connecting to localhost:34321 Info : remote_bitbang driver initialized Info : Note: The adapter "remote_bitbang" doesn't support configurable speed Info : JTAG tap: riscv.cpu tap/device found: 0x00000001 (mfg: 0x000 (<invalid>), part: 0x0000, ver: 0x0) Info : [riscv.cpu] datacount=8 progbufsize=16 Info : [riscv.cpu] Disabling abstract command reads from CSRs. Info : [riscv.cpu] Disabling abstract command writes to CSRs. Info : [riscv.cpu] Examined RISC-V core Info : [riscv.cpu] XLEN=64, misa=0x800000000094112d [riscv.cpu] Target successfully examined. Info : [riscv.cpu] Examination succeed Info : [riscv.cpu] starting gdb server on 3333 Info : Listening on port 3333 for gdb connections riscv.cpu halted due to debug-request. Info : Listening on port 6666 for tcl connections Info : Listening on port 4444 for telnet connections -
Terminal 3: Run GDB to connect to OpenOCD and debug the core
   cd chipyard
   source env.sh

   cd ~/riscv-test

   riscv64-unknown-elf-gdb main.elf -x gdb_init.gdb
Expected output:
   GNU gdb (GDB) 14.1

   Copyright (C) 2023 Free Software Foundation, Inc.
   License GPLv3+: GNU GPL version 3 or later <http://gnu.org/licenses/gpl.html>
   This is free software: you are free to change and redistribute it.
   There is NO WARRANTY, to the extent permitted by law.
   Type "show copying" and "show warranty" for details.
   This GDB was configured as "--host=x86_64-pc-linux-gnu --target=riscv64-unknown-elf".
   Type "show configuration" for configuration details.
   For bug reporting instructions, please see:
   <https://www.gnu.org/software/gdb/bugs/>.
   Find the GDB manual and other documentation resources online at:
       <http://www.gnu.org/software/gdb/documentation/>.

   For help, type "help".
   Type "apropos word" to search for commands related to "word"...
   Reading symbols from main.elf...

   === Chipyard RISC-V GDB Setup ===


Leave a comment